Now Reading: What Is a Type 2 Error? A Simple Guide to Understanding False Negatives in Statistics
-
01
What Is a Type 2 Error? A Simple Guide to Understanding False Negatives in Statistics
When we make decisions based on data, we always want to be right. Whether you are a scientist testing a new medicine, a business owner launching a product, or just someone trying to figure out if it’s going to rain, you look for evidence. However, in the world of statistics, perfection is impossible. Sometimes, we make mistakes. One of the most common and sneaky mistakes is known as a type 2 error.
Imagine a fire alarm that fails to go off even though there is a fire in the kitchen. The alarm “decided” there was no fire, but it was wrong. This is a classic example of a false negative. In statistics, this failure to detect something that is actually happening is exactly what we are talking about.
In this guide, we are going to break down this concept so it is easy to understand. We will look at real-world examples, compare it to other errors, and explore how you can stop it from messing up your data.
Key Takeaways
- A type 2 error is a “false negative,” meaning you failed to detect an effect or difference that actually exists.
- It often happens because the sample size in a study is too small.
- The probability of making this error is represented by the Greek letter Beta ($\beta$).
- Increasing the “power” of a test helps reduce the risk of this error.
- In some cases, like medical testing for dangerous diseases, a type 2 error is much more dangerous than a type 1 error.
Understanding the Basics: What Is a Type 2 Error?
To put it simply, a type 2 error occurs in statistical hypothesis testing when you accept the null hypothesis even though it is actually false. That sentence might sound like a mouthful of jargon, so let’s simplify it.
In statistics, the “null hypothesis” is usually the boring assumption. It assumes that nothing interesting is happening—that the medicine doesn’t work, that the suspect is innocent, or that the new marketing strategy didn’t increase sales. You conduct a test to see if you can prove this boring assumption wrong.
If the medicine does work, but your test results say it doesn’t, you have made a mistake. You missed the truth. That is a type 2 error. It is a missed opportunity. You failed to observe a difference when there really was one. This error is closely related to the concept of “statistical power,” which is the likelihood that a test will correctly identify a real effect. When the risk of this error is high, the statistical power is low.
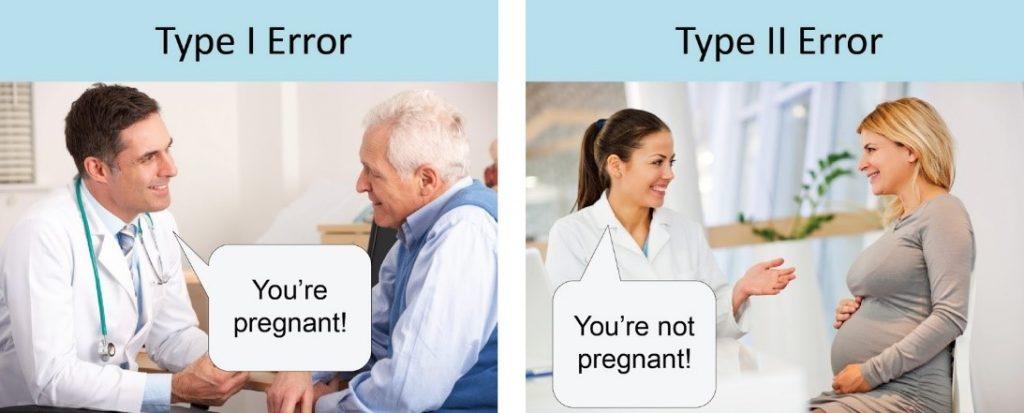
The Difference Between Type 1 and Type 2 Errors
When learning about statistics, people often get confused between type 1 and type 2 errors. They are like two sides of the same coin, but they represent very different mistakes. It is crucial to distinguish between them to understand how accurate your data analysis really is.
A Type 1 error is a “false positive.” This is like a fire alarm going off when there is no fire. You think you found something significant, but it was just a fluke. You rejected the null hypothesis when you shouldn’t have.
On the other hand, a type 2 error is a “false negative.” This is the silent error. It is the fire alarm staying silent while the toast burns. You think nothing happened, but you missed the real event. Remembering this distinction is vital for anyone interpreting data, whether for a school project or a major business decision.
The “Boy Who Cried Wolf” Analogy
A great way to remember the difference is the story of the Boy Who Cried Wolf.
- Type 1 Error (False Positive): The villagers believe there is a wolf when there isn’t one. They are reacting to a false alarm.
- Type 2 Error (False Negative): The villagers believe there is no wolf when there actually is one. This is a type 2 error. The wolf is real, but they failed to detect it, leading to a disastrous result for the sheep.
Real-Life Examples of Type 2 Errors
Statistics can feel abstract until you apply them to real life. Once you start looking, you will see examples of this specific error everywhere. It isn’t just about numbers on a spreadsheet; it affects medicine, law, and daily life.
Medical Testing Scenarios
Imagine a doctor tests a patient for a specific illness. The null hypothesis is “The patient is healthy.” If the patient actually has the illness, but the test comes back negative, the doctor tells the patient they are fine.
This is a dangerous type 2 error. Because the test failed to catch the disease, the patient doesn’t get the treatment they need. In the medical world, minimizing these errors is critical. Doctors would often rather have a few false alarms (Type 1) than miss a life-threatening condition (Type 2).
Quality Control in Manufacturing
Let’s say a factory produces thousands of lightbulbs every hour. A quality control inspector checks a batch to see if they work. The null hypothesis is “This batch of lightbulbs is good.”
If there is a defect in the machinery causing the bulbs to burn out quickly, but the inspector’s small sample doesn’t catch it, they approve the batch for sale. The result? Customers buy bad bulbs. The inspector committed a type 2 error by failing to notice the defect that was right there in the production line.
The Null Hypothesis and Why We Accept It
To really grasp this error, we have to talk about the “Null Hypothesis” ($H_0$). In the scientific method, we don’t set out to prove things true; we set out to reject the idea that they are false. It is a bit of backward logic, but it is the standard for research.
When you perform a test, you are asking, “Is the evidence strong enough to say the null hypothesis is wrong?” If your data is weak, you stick with the null hypothesis.
A type 2 error happens when you stick with the null hypothesis ($H_0$) incorrectly. You say, “There is no evidence of a change,” when the change actually happened. It is like a jury finding a guilty person “not guilty” because there wasn’t enough evidence to convict them. The reality (guilt) was there, but the test (the trial) failed to prove it.
Why Does a Type 2 Error Happen?
You might be wondering, “If the effect is real, why didn’t the test find it?” There are several reasons why a statistical test might fail. Understanding these causes helps researchers design better experiments.
Sample Size Issues
The number one culprit for a type 2 error is a small sample size. If you want to know if a coin is weighted to land on heads, flipping it three times isn’t enough. Even if it is a trick coin, you might get tails twice just by chance.
If your group of participants is too small, the “noise” of random chance can drown out the “signal” of the real effect. You simply don’t have enough data points to prove that the pattern you are seeing is real, so you default to the null hypothesis and miss the truth.
High Variance in Data
Variance refers to how spread out your data points are. Imagine you are trying to measure the average height of a group of people. If everyone is roughly the same height, it is easy to spot an outlier. But if the group ranges from very short to very tall, it is much harder to tell if a specific diet is making them taller on average.
When data is “noisy” or has high variance, it becomes difficult to detect subtle shifts. The real effect gets lost in the mess, leading to a higher probability of a type 2 error.
The Concept of Statistical Power
Statistical power is the hero of our story. It is the probability that a test will correctly reject a false null hypothesis. In other words, it is the ability of the test to find the needle in the haystack.
If a test has “high power,” it means it is very good at detecting real effects. If it has “low power,” it is likely to make a type 2 error. Researchers aim for a power of 0.80 or 80%. This means they want an 80% chance of finding a real effect if one exists. If the power is low, the study might be a waste of time because it wouldn’t find the answer even if it were staring right at it.
Calculating Beta ($\beta$)
In statistics, we love using Greek letters. The probability of committing a type 2 error is denoted by the letter Beta ($\beta$).
- Alpha ($\alpha$): The probability of a Type 1 error (usually set at 0.05 or 5%).
- Beta ($\beta$): The probability of a Type 2 error.
If your $\beta$ is 0.10, that means there is a 10% chance you will miss a real effect. Consequently, your Power is $1 – \beta$ (or 0.90). The lower your Beta, the higher your Power. You want $\beta$ to be as low as possible without making your study impossibly expensive or large.
How to Reduce the Risk of Type 2 Error
So, how do we stop this from happening? Whether you are a student or a professional looking for reliable data like you might find on Forbes Planet, you want your conclusions to be accurate. Here is how researchers fight back against false negatives.
Increasing Sample Size
The most effective way to reduce $\beta$ is to increase the sample size. Asking 1,000 people is always better than asking 10. With more data, the random noise cancels itself out, and the true patterns emerge. This makes it much harder to miss a real effect, significantly lowering the chance of a type 2 error.
Adjusting Significance Levels
This is a bit of a trade-off. If you make it very hard to get a Type 1 error (by setting a very strict standard for proof), you actually make it easier to get a Type 2 error. It’s like tightening a security checkpoint. If you search every single bag to ensure zero threats get through (avoiding false negatives), the line moves slowly. If you wave everyone through to speed things up, you might miss something.
Researchers sometimes adjust the significance level ($\alpha$) slightly to find a balance where they aren’t missing too many real effects while still avoiding false alarms.
The Consequence: Why Does It Matter?
Does it really matter if we make a statistical error? In many cases, yes. The consequences depend entirely on the context.
In business, a type 2 error might mean you decide not to launch a product because your test market showed “no interest,” even though the product would have been a massive hit. You lost money by missing an opportunity.
In environmental science, failing to detect a rise in toxic chemicals in a river (a false negative) means people continue to drink unsafe water. The cost of missing the truth here is human health.
Visualizing the Error (Confusion Matrix)
Sometimes, seeing the data helps. Statisticians use a “Confusion Matrix” to visualize the relationship between the truth and our decisions.
|
Null Hypothesis is Actually True |
Null Hypothesis is Actually False |
|
|---|---|---|
|
We Decide to Accept Null |
Correct Decision |
Type 2 Error (False Negative) |
|
We Decide to Reject Null |
Type 1 Error (False Positive) |
Correct Decision |
As you can see in the table, the type 2 error sits in the box where the Null Hypothesis is actually false (meaning something real is happening), but we decided to accept it anyway.
When is a Type 2 Error Worse than Type 1?
There is a longstanding debate in science about which error is worse. Usually, scientists are terrified of Type 1 errors (saying something is true when it isn’t) because they don’t want to publish false facts.
However, a type 2 error can be worse in safety situations.
- Airport Security: A Type 1 error is annoying (an innocent person gets searched). A Type 2 error is dangerous (a weapon gets on the plane).
- Cancer Screening: A Type 1 error causes temporary stress (a healthy person thinks they are sick but further tests clear them). A Type 2 error is life-threatening (a sick person is told they are healthy and the cancer spreads).
Statistical Significance vs. Practical Significance
Just because you avoid errors doesn’t mean the result matters. Sometimes, you might have a huge sample size and prove that a new teaching method increases test scores by 0.01%.
Statistics might say, “This is real! You did not make a type 2 error!” But practically? That 0.01% doesn’t help anyone. It is important to remember that avoiding statistical errors is just the first step. You also have to ask if the result is meaningful in the real world.
Common Misconceptions
A major misconception is that if you don’t find a significant result, it proves the null hypothesis is true. This is wrong.
Failing to reject the null hypothesis doesn’t prove it is true; it just means you didn’t find enough evidence to prove it false. It is the difference between “Not Guilty” and “Innocent.” A type 2 error hides in that ambiguity. Just because you didn’t see the ghost doesn’t mean the house isn’t haunted; maybe you just blinked at the wrong time.
Summary of Error Types
To wrap things up, let’s look at a comparison list to solidify your knowledge.
- Type 1:
-
- Nickname: False Positive.
- Symbol: Alpha ($\alpha$).
- Analogy: Crying Wolf.
- Risk: Believing a lie.
- Type 2:
-
- Nickname: False Negative.
- Symbol: Beta ($\beta$).
- Analogy: Missing the Wolf.
- Risk: Missing the truth.
Conclusion
Understanding the type 2 error is essential for anyone who wants to think critically about the world. It reminds us that absence of evidence is not evidence of absence. Just because a study didn’t find a link between two things doesn’t mean the link isn’t there; the study might just have lacked the power to find it.
By knowing about these errors, you can look at news headlines, medical test results, and business data with a smarter, more skeptical eye. Whether you are browsing educational resources or reading business insights on sites like Forbes Planet, keeping the concept of false negatives in mind will help you make better, more informed decisions.
Frequently Asked Questions (FAQ)
Q: Can you have a Type 1 and Type 2 error at the same time?
A: No, you cannot. You make a decision to either reject or accept the null hypothesis. A Type 1 error only happens if you reject it, and a type 2 error only happens if you accept it. You can’t do both at once.
Q: What is the standard level for Beta ($\beta$)?
A: Most researchers aim for a Beta of 0.20 or lower. This corresponds to a Statistical Power of 0.80 (80%).
Q: How does sample size affect type 2 errors?
A: Larger sample sizes reduce the risk of a type 2 error. The more data you have, the easier it is to detect small but real effects.
Q: Is a false negative always a bad thing?
A: Not always. In the justice system, we prefer a false negative (letting a guilty person go free due to lack of evidence) over a false positive (putting an innocent person in jail). The context decides which error is “worse.”
Q: Does a p-value tell me if I made a type 2 error?
A: No. The p-value helps you control Type 1 errors. To understand your risk of a type 2 error, you need to calculate the power of the test before you start.
Stay Informed With the Latest & Most Important News
Previous Post
Next Post


Advertisement