Now Reading: Understanding the Red and Blue States Map 2025
-
01
Understanding the Red and Blue States Map 2025
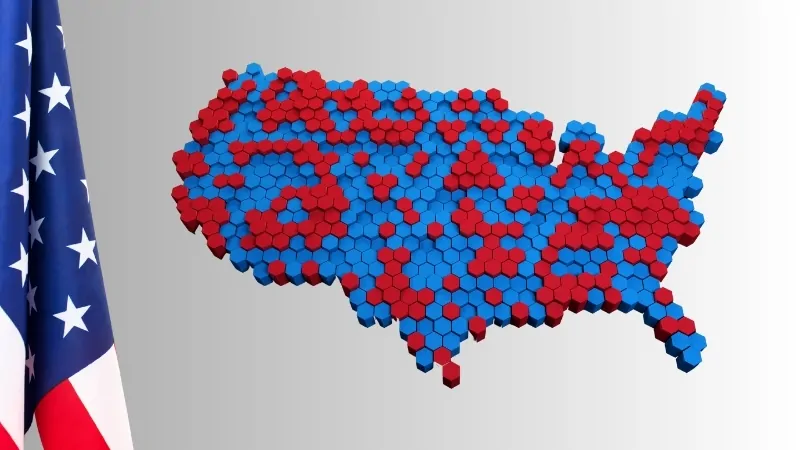
The political landscape of the United States is often visualized as a colorful quilt of red and blue. These colors represent the dominant political leanings of each state, creating a visual shorthand for a complex system. As we look toward the future, understanding the red and blue states map 2025 becomes crucial for anyone interested in American politics. This map isn’t just about election results; it reflects deep-seated cultural, economic, and demographic trends that shape the nation.
This guide will break down what the red and blue state designations mean, how they’ve evolved, and which states are the ones to watch. We will explore the factors that influence a state’s political identity and examine predictions for the coming years. Whether you’re a political junkie or just curious about how the country is divided, this overview will provide a clear and friendly look into the American political map.
What Are Red and Blue States?
In American political jargon, “red states” and “blue states” refer to states that predominantly vote for the Republican and Democratic parties, respectively. This color-coding became a fixture in political commentary following the 2000 presidential election, when major news networks used this scheme to display election results.
- Red States: These states consistently support Republican candidates in presidential and statewide elections. They are often associated with more conservative ideologies, emphasizing individual liberties, limited government intervention, and traditional values. Geographically, red states are more common in the South, the Great Plains, and the Mountain West.
- Blue States: These states reliably vote for Democratic candidates. They are generally linked to more liberal or progressive policies, such as support for social programs, environmental regulations, and government involvement in the economy. Blue states are typically concentrated on the West Coast and in the Northeast.
It’s important to remember that these labels are generalizations. No state is entirely red or blue; every state has a mix of voters from both parties. The designation simply reflects which party’s candidate is more likely to win the majority of votes in a major election.
The Origins of the Color-Coded Map
The association of red with Republicans and blue with Democrats is a relatively recent phenomenon. Before the 2000 election, news outlets used different color schemes, and sometimes they were even reversed. For example, in 1976, NBC used blue for states won by the Republican candidate, Gerald Ford, and red for those won by the Democrat, Jimmy Carter.
The 2000 election between George W. Bush and Al Gore was a turning point. The election was so close that the map was a constant feature on television for weeks. Major media outlets like The New York Times and CNN used red for Republicans and blue for Democrats, and the convention stuck. Now, it’s a universally recognized system for discussing the political divide.
Key Factors That Define a State’s Political Leanings
A state’s political identity isn’t random. It’s shaped by a complex interplay of demographics, economics, and cultural values. When we examine a red and blue states map 2025, we’re seeing a snapshot of these powerful forces at work.
Demographics: The People Behind the Politics
Population characteristics play a massive role in determining whether a state leans red or blue.
- Urban vs. Rural Divide: This is one of the most significant predictors of voting behavior. Densely populated urban centers are overwhelmingly blue, while rural and sparsely populated areas are deeply red. Suburban areas are often the battlegrounds where elections are won or lost.
- Age: Younger voters, particularly Millennials and Gen Z, tend to vote for Democrats at higher rates than older generations like Baby Boomers, who are a more reliable base for Republicans.
- Race and Ethnicity: Voting patterns often differ among racial and ethnic groups. For instance, African American and Hispanic voters have historically shown strong support for the Democratic party, while a majority of white voters tend to favor the Republican party.
Economic Drivers and Their Political Impact
A state’s economy can heavily influence its politics. States with economies centered on industries like manufacturing, agriculture, and energy extraction often lean Republican. These voters may favor policies like deregulation and lower taxes. In contrast, states with economies driven by technology, finance, and education tend to be more Democratic, with residents who may support investments in public services and environmental protection.
Cultural and Social Values
Cultural identity is another powerful force. Issues like religion, gun control, and social justice can create deep divisions.
- Religion: Voters who identify as evangelical Christians are a core component of the Republican base. Conversely, religiously unaffiliated voters are one of the most reliably Democratic groups.
- Social Issues: A state’s stance on social issues can be a strong indicator of its political leaning. States with more liberal views on topics like LGBTQ+ rights and abortion access are typically blue, while those with more conservative stances are red.
Projecting the Red and Blue States Map 2025
Predicting the exact political map of the future is impossible, but we can analyze current trends to make educated projections. The red and blue states map 2025 will likely show both stability and change. Many states are so solidly partisan that their status is unlikely to shift. However, a handful of “swing states” or “purple states” will be the center of political attention.
Solidly Red States
These states have a long history of voting for Republican candidates by significant margins. Barring a major political realignment, they are expected to remain red in 2025 and beyond.
- Wyoming
- Idaho
- North Dakota
- South Dakota
- Alabama
- Oklahoma
- Arkansas
Solidly Blue States
Similarly, these states are reliable strongholds for the Democratic party. Their large urban populations and progressive values make them difficult for Republicans to win.
- California
- New York
- Massachusetts
- Maryland
- Illinois
- Washington
- Hawaii
The Battleground: Key Swing States to Watch
The real political drama unfolds in the swing states. These are states where both parties have a reasonable chance of winning, and they often decide the outcome of presidential elections. Their political landscape is fluid, and they will be the focus of intense campaigning. For more insights on global trends that can influence domestic politics, you might find articles on platforms like https://forbesplanet.co.uk/ interesting.
The Rust Belt Trio: Pennsylvania, Michigan, and Wisconsin
These three states were once reliably Democratic, thanks to their strong union presence and manufacturing base. However, economic changes have made them highly competitive. Donald Trump’s victories here in 2016 were a shock to the political establishment, while Joe Biden’s wins in 2020 demonstrated their swing status. Their diverse mix of urban, suburban, and rural voters makes them perennial toss-ups.
The Sun Belt Shift: Arizona and Georgia
Arizona and Georgia have been undergoing a significant political transformation. For decades, both were reliably red. However, rapid population growth, particularly in the suburbs of Phoenix and Atlanta, has brought in a more diverse and educated electorate. These demographic shifts have made both states incredibly competitive, as seen in the Democrats’ narrow victories in 2020. The evolution of these states will be a major storyline on the red and blue states map 2025.
Other Key States on the Radar
- North Carolina: A state of contrasts, with booming cities like Charlotte and Raleigh-Durham leaning blue and vast rural areas remaining deeply red. It has been decided by razor-thin margins in recent elections.
- Nevada: A unique swing state with a powerful service-based economy and a significant Hispanic population. Its political future is tied to the growth of Las Vegas and Reno.
- Florida: Often called the “swingiest” of swing states, Florida is known for its incredibly close elections. Its diverse population of retirees, Hispanic voters, and transplants from other states makes it politically unpredictable.
State Political Leaning Projections for 2025
While things can change, here is a speculative table based on current trends.
|
State |
Projected Leaning |
Key Factors |
|---|---|---|
|
Texas |
Leans Republican |
Growing urban/suburban areas are making it more competitive, but still GOP-favored. |
|
Pennsylvania |
Toss-Up |
Classic Rust Belt battleground; elections decided in the suburbs of Philadelphia and Pittsburgh. |
|
Arizona |
Toss-Up |
Rapid demographic change and a growing Hispanic electorate have made it highly competitive. |
|
Georgia |
Toss-Up |
Major demographic shifts around Atlanta have turned this formerly red state into a true battleground. |
|
Ohio |
Leans Republican |
Formerly a quintessential swing state, it has trended more reliably red in recent years. |
|
Wisconsin |
Toss-Up |
A deeply divided state where elections are often won by less than one percentage point. |
|
Michigan |
Leans Democratic |
While competitive, Democrats have shown strength here in recent election cycles. |
|
California |
Solid Democratic |
The most populous state and a bastion of Democratic politics. |
|
Wyoming |
Solid Republican |
The least populous state and one of the most reliably Republican. |
Conclusion: A Dynamic and Evolving Map
The red and blue states map 2025 is more than just a tool for election night. It is a reflection of a nation in flux. While many states remain firmly anchored in their political traditions, demographic and economic shifts are redrawing the boundaries of the political battlefield. The growing divide between urban and rural America continues to deepen, while the suburbs have emerged as the new political center ground.
States like Arizona, Georgia, and Pennsylvania will continue to capture the nation’s attention as they swing between the two parties. Their outcomes will not only determine who holds power but also signal the future direction of the country. Understanding these dynamics is key to making sense of American politics today and in the years to come. The map is not static; it is a living document that tells the ongoing story of America.
Frequently Asked Questions (FAQ)
What determines if a state is red or blue?
A state is designated red or blue based on which party’s candidates it predominantly supports in major elections, especially presidential elections. Red states vote Republican, and blue states vote Democratic. This is determined by a combination of demographics, economic factors, cultural values, and historical voting patterns.
Can a red state become a blue state, or vice versa?
Yes, absolutely. This is known as a political realignment. States can shift their political leanings over time due to demographic changes, economic shifts, or a major event that alters public opinion. For example, Georgia and Arizona have shifted from solidly red to competitive swing states over the last decade. West Virginia, once a Democratic stronghold, is now one of the most Republican states.
What is a purple state?
A “purple state” is another term for a swing state or battleground state. It’s a mix of red and blue, meaning both the Democratic and Republican parties have a strong base of support and a reasonable chance of winning in statewide elections. These are the states that receive the most attention from political campaigns.
How accurate are predictions for the red and blue states map 2025?
Predictions are based on current data, polling, and historical trends. While they provide a good idea of the political landscape, they are not guaranteed. Unforeseen events, candidate quality, and voter turnout can all influence election outcomes. Projections for a red and blue states map 2025 should be seen as educated guesses rather than certainties.
Stay Informed With the Latest & Most Important News
Previous Post
Next Post


Advertisement